.png)
PYTHON TRAINING
FOR DATA SCIENCE
Your first step toward mastering data science with Python.

Introduction to Python
Data Cleansing and Exploratory Data Analysis
with
ANACONDA
Linear Regression for Data Science
Data Visualization

About Program
Python Training for Data Science
The Python for Data Science training introduces participants to essential programming and analytical skills using Python. The program covers basic programming concepts, data manipulation, data cleaning, and exploratory data analysis with Pandas.
Participants also learn data visualization techniques and the fundamentals of linear regression for predictive modeling. By the end of the training, they will be able to process, analyze, and visualize data effectively using Python.

Training Tools
About Modules
Training Module
What will you be taught during the training?
Day 1
Day 2
Day 3
Day 4
INTRODUCTION TO PYTHON
Day 1
In this first session of the Python for Data Science training, participants will learn the fundamental concepts of Python programming, including displaying data, understanding and initializing data types with variables, checking data types, data indexing and slicing, and using conditional statements for decision-making. The session also introduces basic Python libraries, simple arithmetic operations, data structures such as dictionaries, counters, and function creation. By the end of the session, participants will have a solid foundation to begin applying Python in data analysis.

DATA CLEANSING AND EXPLORATORY DATA ANALYSIS
Day 2
In the second session of the Python for Data Science training, participants will learn data cleansing processes to ensure data quality prior to analysis, including identifying and handling missing values, duplicate data, and inconsistencies within datasets. In addition, participants will be introduced to Exploratory Data Analysis (EDA) to extract insights, patterns, and data characteristics through descriptive statistics and initial analysis. This session also covers dataset editing and manipulation techniques such as renaming columns and rows, grouping data (group by), adding and removing rows or columns, and performing various data transformations. By the end of the session, participants are expected to be able to clean, understand, and prepare datasets effectively for further data analysis.
_edited.jpg)
DATA VISUALIZATION
Day 3
In the third session of the Python for Data Science training, participants will learn how to visualize datasets to support data analysis and insight generation. This module introduces the purpose and principles of data visualization, followed by hands-on practice in creating and interpreting various types of charts, including Bar Charts, Line Charts, Pie Charts, Combo Charts, and Scatter Plots. Participants will explore how different visualizations can be used to identify trends, patterns, comparisons, and relationships within data. By the end of the session, participants are expected to be able to select appropriate visualization types and effectively analyze data through visual representations.
.png)
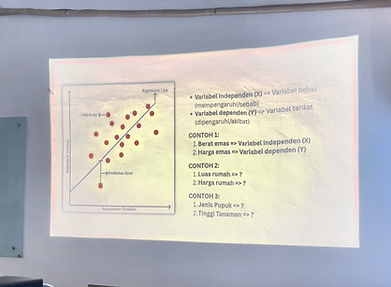
LINEAR REGRESSION
Day 4
In the fourth session of the Python for Data Science training, participants will learn the fundamentals and practical applications of the Linear Regression method for predictive analysis. This module covers the purpose and use cases of linear regression, steps to build a linear regression model, and the importance of data normalization to improve model performance. Participants will also learn how to evaluate and test linear regression prediction models using cost functions to measure prediction error and model accuracy. By the end of the session, participants are expected to be able to develop, train, and evaluate a linear regression model for data-driven prediction tasks.
.png)
Training Material
Training Module 2025

Training Ganttchart 2025